はじめに
本エントリーは React Advent Calendar 2020 5日目のエントリーです。
地図アプリの開発では、よく Google Maps API を使用するケースが多いと思いますが、最近は、Mapbox や ArcGIS、オープンソースを利用して開発するケースも増えてきています。今回は、ArcGIS の ArcGIS API for JavaScript で React を使ってみましたので、インストールから簡単な地図データの表示までを紹介したいと思います。
今回使用したソース一式は以下の GitHub にも登録しています。 github.com
2021年の React Advent Calendar 2021 11日目の記事として、以下の記事も書きましたので、ご興味のある方はご参照していただければと思います。
ArcGIS API for JavaScript とは
地図アプリ開発用の API で 2D・3D 地図アプリを開発することができます。豊富な地図の可視化機能や CSV や GeoJSON などの地図データの表示を行うことができます。また、ArcGIS というプラットフォームに対応しているため、ArcGIS 上にあるデータを表示することも可能です。それ以外にも OGC などの WMS や WMTS などにも対応しているため、ArcGIS 以外のデータフォーマットにも対応しています。より詳細については、以下の サイトでサンプルや API リファレンスなどがあります。
React のインストール
まず、はじめに以下のコマンドで、React のアプリケーションを作成します。npm start で React のアプリケーションが起動します。
npx create-react-app my-app
cd my-app
npm start
そして、今起動中のアプリを停止して、次に ArcGIS API for JavaScript が利用できるように以下のコマンドで esri-loader をインストールします。
npm install --save esri-loader
esri-loader は、ArcGIS API for JavaScript のホストされたビルドから実行時にモジュールを遅延ロードするための小さなライブラリです。
これで、React アプリケーションで ArcGIS API for JavaScript を利用した開発の準備が整いました。 https://developers.arcgis.com/javascript/latest/guide/react/developers.arcgis.com
React Hooks を利用して React コンポーネントを作成
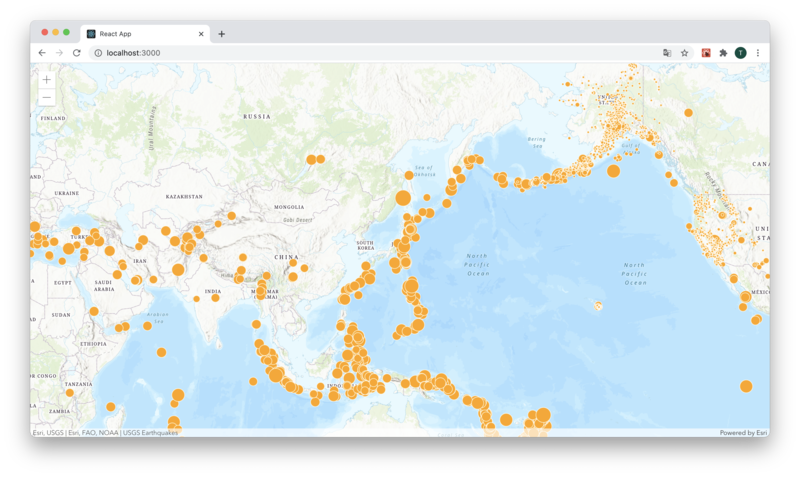
ArcGIS API for JavaScript を利用して背景地図を表示して、さらに GeoJSON レイヤーを利用して、USGS からのリアルタイムデータを表示してみました。ここでは、React Hooks を使ってマップを表示するための React コンポーネントを作成します。
WebMapView.js
import React, { useEffect, useRef } from 'react';
import { loadModules } from 'esri-loader';
import './WebMapView.css';

export const WebMapView = () => {
    const mapRef = useRef();

    useEffect(
      () => {
        // lazy load the required ArcGIS API for JavaScript modules and CSS
        loadModules(['esri/Map', 'esri/views/MapView',  "esri/layers/GeoJSONLayer",], { css: true })
        .then(([ArcGISMap, MapView, GeoJSONLayer]) => {

          const map = new ArcGISMap({
              basemap: 'topo-vector'
          });

          const url = "https://earthquake.usgs.gov/earthquakes/feed/v1.0/summary/all_month.geojson";

          const template = {
            title: "Earthquake Info",
            content: "Magnitude {mag} {type} hit {place} on {time}",
            fieldInfos: [
              {
                fieldName: "time",
                format: {
                  dateFormat: "short-date-short-time"
                }
              }
            ]
          };

          const renderer = {
            type: "simple",
            field: "mag",
            symbol: {
              type: "simple-marker",
              color: "orange",
              outline: {
                color: "white"
              }
            },
            visualVariables: [
              {
                type: "size",
                field: "mag",
                stops: [
                  {
                    value: 2.5,
                    size: "4px"
                  },
                  {
                    value: 8,
                    size: "40px"
                  }
                ]
              }
            ]
          };

          const geojsonLayer = new GeoJSONLayer({
            url: url,
            copyright: "USGS Earthquakes",
            popupTemplate: template,
            renderer: renderer //optional
          });

          map.add(geojsonLayer);

          // load the map view at the ref's DOM node
          const view = new MapView({
            container: mapRef.current,
            map: map,
            center: [139.767125, 35.681236],
            zoom: 3
          });

          return () => {
            if (view) {
              // destroy the map view
              view.destroy();
            }
          };
        });
      }
    );

    return <div className="webmap" ref={mapRef} />;
};
Render
WebMapView.css
.webmap {
    height: 100vh;
}
以下のように 他の React コンポーネントと同じように作成したコンポーネントをレンダリングすることができます。
index.js
import React from 'react';
import ReactDOM from 'react-dom';
import './index.css';
import { WebMapView } from './components/WebMapView';
import reportWebVitals from './reportWebVitals';

ReactDOM.render(
  <React.StrictMode>
    <WebMapView />
  </React.StrictMode>,
  document.getElementById('root')
);

// If you want to start measuring performance in your app, pass a function
// to log results (for example: reportWebVitals(console.log))
// or send to an analytics endpoint. Learn more: https://bit.ly/CRA-vitals
reportWebVitals();
以下のような地図アプリが作成できます。
さいごに
今回は、React Hooks を利用しましたが、React Class を使用して開発することも可能です。詳細については以下を参照していただければと思います。
https://developers.arcgis.com/javascript/latest/guide/react/developers.arcgis.com
また、今回は ArcGIS API for JavaScript の使い方や API 等については紹介していませんが、詳しい使い方については以下に紹介されています。 developers.arcgis.com
React についてはまだまだ知識不足なので、もっと学んでいきたいと思います。