はじめに
今回は GPS データを使用して、3D マッピングしてみました。地図は、ArcGIS API for JavaScript の標高プロファイル ウィジェットを使用して表示してみました。
標高プロファイル ウィジェットを使用した GPS データの表示にはこちらのブログを参考にさせていただきました。 www.esri.com
GPS データの利用
私自身あまりGPSデータには馴染みはないのですが、GPS デバイスを使用して記録した場合、データは gpx または tcx 形式になります。このデータを ArcGIS API for JavaScript などの JavaScript で読み込む場合には、Tom MacWright 氏が作成した小さなライブラリ togeojson を使用することで可能です。
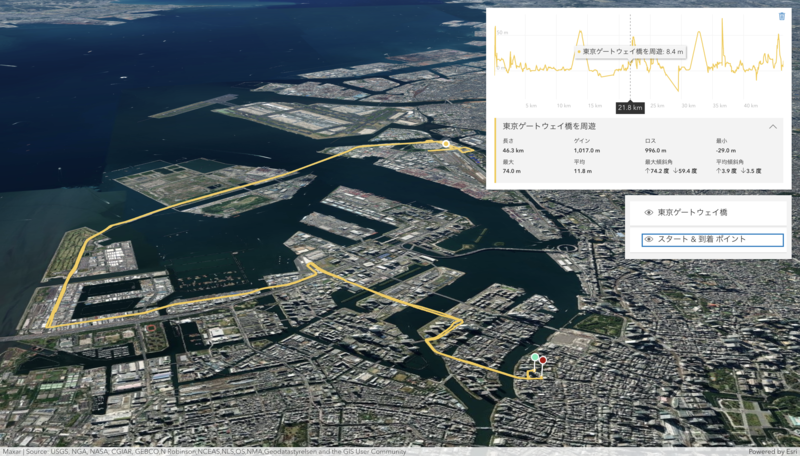
今回は、gpxトラックを使用しました。GPS データは 以下の GPSデータ記録形式 KMLとGPX の中で紹介されている東京ゲートウェイ橋を周遊の gatebridge.gpx データを使用させていただきました。
ソースでは以下のような感じで gpx ファイルを GeoJSON に変換してくれます。
  // read the gpx file and convert it to geojson
  const response = await fetch("./2013_may02_GateBridge.gpx");
  const gpxcontent = await response.text();
  const geojson = gpx(new DOMParser().parseFromString(gpxcontent, "text/xml"));
  //const heartRates = geojson.features[0].properties.coordinateProperties.times;
  const coordinates = geojson.features[0].geometry.coordinates;

  // add the track as an input for the ElevationProfile widget
  const geometry = new Polyline({
    paths: [coordinates],
    hasZ: true
  });
標高プロファイル ウィジェットの利用
標高プロファイル ウィジェットは、入力されたデータから標高を生成・表示することができます。標高プロファイルでは、距離、高度、急勾配などの情報を表示することができます。
const elevationProfile = new ElevationProfile({
  view: view,
  container: "profile",
  // pass the bike track geometry into the input property
  input: {
    geometry: geometry
  },
  profiles: [
    {
      // displays elevation values from the input geometry
      type: "input", //autocasts as new ElevationProfileLineInput()
      color: "yellow",
      title: "東京ゲートウェイ橋を周遊"
    },
  ],
  // UI elements that shouldn't be visible
  visibleElements: {
    sketchButton: false,
    selectButton: false
  }
});

// add the elevation profile to the view UI
view.ui.add(elevationProfile, "top-right");
以下のように GPS データの標高をグラフみたいな感じで表示することができます。また、3D で表示している背景地図などの標高ソースデータを使用して標高を表示することも可能です。

GPS の軌跡の表示として、移動の開始点と終了点を緑と赤のポイントで表示しました。標高プロファイル ウィジェットは、凡例のチェックボックスで個々のプロファイルを隠すことができます。チャートの単位は、設定メニューでメートル法、インペリアル法、または特定の単位に設定できます。チャート上をクリック&ドラッグすると、プロファイル・チャートの特定の部分がズームインします。ズームインした状態でマイナスボタンをクリックすると、ズームがリセットされます。
JavaScript 部分の全体のソースは以下となります。
import { gpx } from "https://unpkg.com/@tmcw/togeojson?module";

import EsriMap from "esri/Map.js";
import SceneView from "esri/views/SceneView.js";
import ElevationProfile from "esri/widgets/ElevationProfile.js";
import LayerList from "esri/widgets/LayerList.js";
import FeatureLayer from "esri/layers/FeatureLayer.js";
import { LineSymbol3D, LineSymbol3DLayer, PointSymbol3D, IconSymbol3DLayer } from "esri/symbols.js";
import { Polyline, Point } from "esri/geometry.js";
import ElevationProfileLineInput from "esri/widgets/ElevationProfile/ElevationProfileLineInput.js";
import Graphic from "esri/Graphic.js";

const map = new EsriMap({
  basemap: "satellite",
  ground: "world-elevation",
});

const view = new SceneView({
  map: map,
  container: "viewDiv",
  qualityProfile: "high",
  camera: {
    position: [
        139.81746940,
        35.74449120,
        4951.30461
    ],
    heading: 194.11,
    tilt: 69.67
  },
  environment: {
    atmosphere: { quality: "high" },
  },
  ui: {
    components: ["attribution"],
  },
  popup: {
    defaultPopupTemplateEnabled: true
  }
});

const elevationProfile = new ElevationProfile({
  view,
  profiles: [
    new ElevationProfileLineInput({ color: [245, 203, 66], title: "東京ゲートウェイ橋を周遊" }),
  ],
  visibleElements: {
    selectButton: false,
    sketchButton: false,
    settingsButton: false,
  },
});

view.ui.add(elevationProfile, "top-right");

(async () => {
  // read the gpx file and convert it to geojson
  const response = await fetch("./2013_may02_GateBridge.gpx");
  const gpxcontent = await response.text();
  const geojson = gpx(new DOMParser().parseFromString(gpxcontent, "text/xml"));
  //const heartRates = geojson.features[0].properties.coordinateProperties.times;
  const coordinates = geojson.features[0].geometry.coordinates;

  // add the track as an input for the ElevationProfile widget
  const geometry = new Polyline({
    paths: [coordinates],
    hasZ: true
  });
  elevationProfile.input = new Graphic({ geometry: geometry });

  // create a second layer of the bike track
  // displaying the heart rate on each segment
  const source = [];
  // here we sample every second point to get better performance
  for (let i = 0; i < coordinates.length - 2; i+=2) {
    const point1 = coordinates[i];
    const point2 = coordinates[i+2];
    const id = i;
    source.push(getPolyline({
      point1,
      point2,
      id
    }));
  }

  const bikeTrackLayer = new FeatureLayer({
    source: source,
    objectIdField: "ObjectID",
    title: "東京ゲートウェイ橋",
    fields: [{
      name: "ObjectID",
      alias: "ObjectID",
      type: "oid"
    }],
    elevationInfo: {
      mode: "relative-to-ground",
      featureExpressionInfo: {
        expression: "5"
      }
    },
    visible: true,
    renderer: {
      type: "simple",
      symbol: new LineSymbol3D({
        symbolLayers: [new LineSymbol3DLayer({
          material: { color: [245, 203, 66] },
          size: 3,
          join: "round",
          cap: "round"
        })]
      })
    }
  });

  // create a point layer showing the start and the end points of the track
  const start = coordinates[0];
  const startPoint = {
    geometry: new Point({
      x: start[0],
      y: start[1],
      z: start[2]
    }),
    attributes: {
      ObjectID: 1,
      type: "start"
    }

  };
  const end = coordinates[coordinates.length - 1];
  const endPoint = {
    geometry: new Point({
      x: end[0],
      y: end[1],
      z: end[2]
    }),
    attributes: {
      ObjectID: 2,
      type: "end"
    }
  };

  const pointsLayer = new FeatureLayer({
    source: [startPoint, endPoint],
    objectIdField: "ObjectID",
    title: "スタート & 到着 ポイント",
    fields: [{
      name: "ObjectID",
      alias: "ObjectID",
      type: "oid"
    }, {
      name: "type",
      alias: "type",
      type: "string"
    }],
    renderer: {
      type: "unique-value",
      field: "type",
      uniqueValueInfos: [{
        value: "start",
        symbol: getPointSymbol([108, 235, 184]),
        label: "スタート ポイント"
      }, {
        value: "end",
        symbol: getPointSymbol([168, 8, 8]),
        label: "到着 ポイント"
      }],
      legendOptions: {
        title: " "
      }
    }
  });

  map.addMany([pointsLayer, bikeTrackLayer]);

  const layerList = new LayerList({
    view: view,
  });

  view.ui.add(layerList, "top-right");

  view.watch("camera", () => {
    const p = view.camera.position;
    if (p.spatialReference.isWebMercator || p.spatialReference.isWGS84) {
        console.log(`
            {
                position: [
                    ${p.longitude.toFixed(8)},
                    ${p.latitude.toFixed(8)},
                    ${p.z.toFixed(5)}
                ],
                heading: ${view.camera.heading.toFixed(2)},
                tilt: ${view.camera.tilt.toFixed(2)}
            }`
        );
    } else {
        console.log(`
            {
                position: {
                    x: ${p.x.toFixed(5)},
                    y: ${p.y.toFixed(5)},
                    z: ${p.z.toFixed(3)},
                    spatialReference: ${p.spatialReference.wkid}
                },
                    heading: ${view.camera.heading.toFixed(2)},
                    tilt: ${view.camera.tilt.toFixed(2)}
                }`
        );
    }
  });

})();

function getPolyline(values) {
  const {point1, point2, heart1, heart2, id} = values;
  const avgHeartRate = (heart1 + heart2)/2;
  return {
    geometry: new Polyline({
      paths: [[point1, point2]],
      hasZ: true
    }),
    attributes: {
      ObjectId: id,
    }
  };
}

function getPointSymbol(color) {
  return new PointSymbol3D({
    symbolLayers: [new IconSymbol3DLayer({
      resource: { primitive: "circle"},
      material: { color: color },
      outline: {
        color: [255, 255, 255, 1],
        size: 1.5
      },
      size: 10
    })],
    verticalOffset: {
      screenLength: 40,
      maxWorldLength: 200,
      minWorldLength: 20
    },
    callout: {
      type: "line",
      size: 1.5,
      color: [255, 255, 255, 1],
      border: {
        color: [0, 0, 0, 0]
      }
    }
  });

}
全体のソースは、GitHub にもあります。 github.com
さいごに
標高プロファイル ウィジェットは、今回初めて使用しましたが、他のライブラリにはなく、標高の表示を簡単に実装することができるの ですごく便利だなと思いました。GPS データなどをアプリで表示する場合などは便利な機能ではないでしょうか。